A method of quantitative analysis based on deviation coefficient and sliding time window

首发时间:2020-01-03
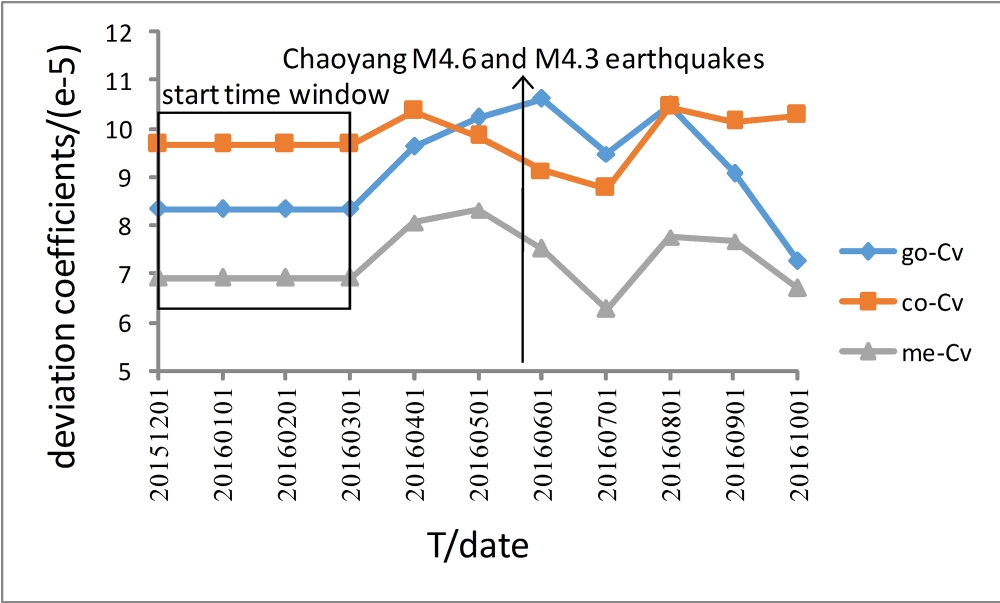
Abstract:In order to scientifically and accurately describing the shape of deviation distribution curve of the short-level segment data of seismostation, this paper used deviation coefficient and sliding time window to analyze and summarize trends of deviation distribution curves of 2-3(k) segment of Chaoyang seismostation quantitatively before and after Chaoyang M4.6 and M4.3 earthquakes on May 22, 2016: general data anomalies caused by crustal deformation reveal the deviation coefficients get larger and the shapes of deviation distribution curves of the segment deviate from normal distribution before the earthquake, and the deviation coefficients get smaller and the shapes of deviation distribution curves of the segment restore to normal distribution after the earthquake. Then preliminary analysis of earthquake risk near the seismostation was made based on recent data. As a result, the figures prove that this quantitative analysis method has reference valuable for data anomalies recognition before earthquake to a certain extent, which also provides a new way of research for earthquake monitoring and prediction analyzing.
keywords: surveying and mapping deviations statistics deviation coefficient deviation distribution curve sliding time window quantitative analysis earthquake
点击查看论文中文信息
一种基于变差系数与滑动时间窗的定量分析方法
摘要:为科学、准确的描述台站短水准测段离差分布曲线与正态分布曲线的偏离程度,本文以朝阳桃花吐台站为例,利用变差系数结合滑动时间窗对20160522朝阳M4.6与M4.3地震前后台站2-3(k)测段离差分布曲线的变化趋势进行了定量分析与总结:一般震前由地壳形变引起的数据异常表现为测段变差系数增大,测段离差分布曲线偏离正态分布,震后测段变差系数减小,测段离差分布曲线恢复正态分布。进而基于最新数据对台站邻近区域的地震危险性进行了初步分析。通过效果图可知,该定量分析方法可为震前数据异常识别提供参考,为地震监测与分析预测提供了一种新思路、新途径。
基金:
论文图表:

引用


No.****
动态公开评议
共计0人参与
勘误表
一种基于变差系数与滑动时间窗的定量分析方法
中国科技论文在线 版权所有
网站地图|
在线首页|
在线简介|
服务条款|
联系我们

京公网安备 11040202430024号 京ICP备15006316号-2| 网络出版服务许可证 (总)网出证(京)字第083号 | 文保网安备案号:1101080066


 .txt
.txt .ris
.ris .doc
.doc
评论
全部评论